Work it Out
Question 12
Chapter 3. Question 12
Work it Out
true
The accompanying table gives the annual U.S. demand and supply schedules for pickup trucks.
| Price of truck | Quantity of trucks demanded (millions) | Quantity of trucks supplied (millions) |
|---|---|---|
| $20,000 | 20 | 14 |
| 25,000 | 18 | 15 |
| 30,000 | 16 | 16 |
| 35,000 | 14 | 17 |
| 40,000 | 12 | 18 |
Table
Using the data from the table, find the equilibrium price and quantity.
| A. |
| B. |
| C. |
| D. |
0:10
Multiple Choice
1.
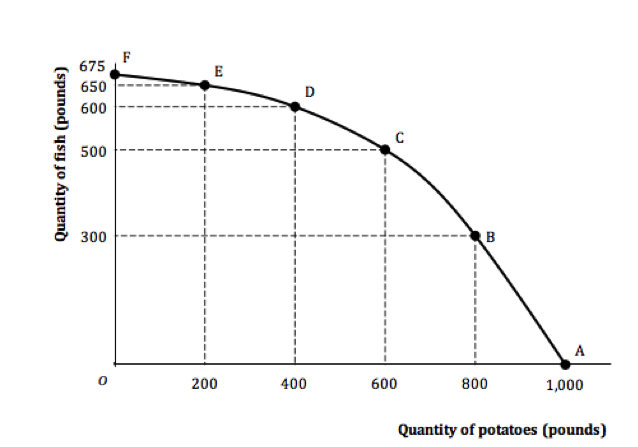
Can Atlantis produce 500 pounds of fish and 800 pounds of potatoes? Explain. Where would this point lie relative to the production possibility frontier?
| A. |
| B. |
| C. |

Fill-in-the-blanks
2.
Assume the economy of Atlantis only produces fish (point F).

Calculate the opportunity cost of producing potatoes in 200 pound increments.
| Maximum annual Output options | Quantity of potatoes (points) | Opportunity cost of potatoes in terms of fish |
|---|---|---|
| F | 0 | - |
| E | 200 | |
| D | 400 | |
| C | 600 | |
| B | 800 | |
| A | 1,000 |
Table
To calculate the opportunity cost of producing potatoes (in terms of producing fish) you must calculate the change in fish produced as potato production is increased. For example, as potato production increases from 0 to 200 pounds, fish production decreases from 675 to 650 pounds. So the opportunity cost of producing the first 200 pounds of potatoes is 25 pounds of fish. Similarly when increasing potato production from 200 to 400 pounds results in a decrease in fish production from 650 to 600 pounds of fish. Increasing potato production from 600 to 800 pounds results in a decrease in the production of fish from 500 to 300 pounds, or an opportunity cost of 200 pounds of fish.
Essay
| Maximum annual Output options | Quantity of potatoes (points) | Opportunity cost of potatoes in terms of fish |
|---|---|---|
| F | 0 | - |
| E | 200 | 25 |
| D | 400 | 50 |
| C | 600 | 100 |
| B | 800 | 200 |
| A | 1,000 | 300 |
Table
3.
Can you explain why the opportunity cost of producing 200 pounds for potatoes is not the same as producing 800 pounds of potatoes? What does this imply about the slope of the production possibility frontier?
In your response you should note that as the island of Atlantis faces increasing opportunity costs. Starting with no production of potatoes (point F) and increasing production to 200 pounds means decreasing the production of fish from 675 to 650 pounds of fish. Further increase the production of potatoes to 400 pounds means decreasing fish production from 650 pounds to 600 pounds. You will notice that every 200 pounds of potatoes the island must give up more and more pounds of fish. Finally increasing potato production from 800 to 1000 pounds costs 300 pounds of fish. You will notice the production possibilities frontier gets steeper as the island produces more pounds potatoes and few pounds of fish.
The changing opportunity cost implies that the more potatoes Atlantis produces, the higher the opportunity cost becomes. For instance, as you grow more and more potatoes, you have to use less and less suitable land to do so. As a result, you have to divert increasingly more resources away from fishing as you grow more potatoes, meaning that you can produce increasingly less fish. This implies, of course, that the production possibility frontier becomes steeper the farther you move along it to the right; that is, the production possibility frontier is bowed out.